利用VMWARE虚拟机获取USB数据报文并通过Virtual USB Analyzer分析
本文地址:http://tongxinmao.com/Article/Detail/id/239
Capturing a log file
To use the Virtual USB Analyzer, you first need to capture a log of some USB protocol traffic. This tutorial will show you how to use the logging built in to VMware's virtual USB stack. You'll need either VMware Workstation, VMware Fusion, or the free VMware Player as well as a virtual machine and USB device you want to capture data from.
Note that you can capture the log file using any host operating system, and your virtual machine can be running any operating system that supports USB. However, you'll probably want to analyze the resulting logs on a Linux machine- the vusb-analyzer tool may be difficult to run on Windows or Mac OS. See the system requirements.
The virtual machine configuration file
For this step, you'll need to edit your virtual machine's configuration file. This is the text file with a ".vmx" extension, which specifies all of a virtual machine's devices, shared folders, debug options, and other settings. On Windows, you'll want to use Wordpad or any programmer's editor. On Linux or Mac OS, any plain text editor should work.
This .vmx file is the same file you open in VMware Workstation or Player in order to load the virtual machine. In VMware Fusion, the VM may be a bundle, a directory which appears as a single file in the Finder. In this case, you'll need to open the bundle by right-clicking it and selecting "Show Package Contents."
!You must modify the VM's config file only when the virtual machine is powered off or suspended. Any time you power off or suspend the VM, the config file will be modified automatically. Be sure to reload it in your editor if you had the file open prior to a power or suspend operation.
!VMware Player 3.0 for Windows was not packaged with the debug version of the VMX binary, so the debugging options below will silently have no effect. This only affects the Windows release. We're working on resolving this problem, but until then you'll have to use a different product. For example, Player 3.0 for Linux, Player 2.0, any version of Fusion, or a trial version of Workstation. Sorry for the inconvenience.
USB debug options
There are three configuration changes we'll make in order to use USB logging:
monitor = "debug"
Enable debugging for this VM. This switches to a different version of the VMware virtual machine runtime which is compiled with debug checks enabled. This is the same as setting the "Gather debugging information" advanced option in VMware Workstation to "Full." Note that this option only takes effect the next time you power on the virtual machine.
usb.analyzer.enable = TRUE
Enable USB analyzer logging in the virtual USB stack. This will write "USBIO:" lines to this virtual machine's vmware.log file on every USB packet.
usb.analyzer.maxLine = <number of 16-byte lines>
This is optional, but we'll increase the length of the payload data that we log for each USB packet. By default, only 80 bytes (5 hex dump lines) of data are logged for each packet. To see the entire contents, we'll increase this to 8192. This will make your log files significantly bigger, so if you don't need the full packet contents you can set this to a small number to decrease logging overhead.
mouse.vusb.enable = FALSE
This is also optional. By default, some virtual machines (Windows NT and later) will get a virtual USB mouse device by default. From the guest's point of view it looks like a normal USB device, but it is emulated entirely in software. This device will show up in the USB log output. If the extra output gets in the way, you can use this option to disable the virtual USB mouse. Note that with the virtual USB mouse disabled, mouse functionality in the VM may be reduced.
Also note that this option only tells the virtual USB subsystem when to attach a new virtual mouse. If the mouse is already attached, you'll need to remove the corresponding "usb:" lines. See the example below.
!These logging options can have a significant impact on the performance of your VM, and they generate large log files that can fill your disk. Remember to suspend or power off your VM and remove the debug options when you're done.
So, to enable debugging, enable the USB analyzer, and set the line length, we'll add these three lines to the VMX file. Note that the VMX file must not contain duplicate values for a single key. Make sure these config options don't already exist before adding them, or your VM will fail to start.
monitor = "debug"
usb.analyzer.enable = TRUE
usb.analyzer.maxLine = 8192
mouse.vusb.enable = FALSE
USB logging output
When you power on or resume this VM, you should start to see USBIO log lines invmware.log for each USB packet that traverses the virtual USB stack. On most Windows VMs, you will immediately see some USBIO log lines for the two virtual peripherals that automatically attach to every VM: The virtual hub and virtual mouse. (If you did not elect to disable the virtual mouse, that is.)
Some example USBIO log entries:
USBIO: GetDescriptor(string, 1, langId=0x0409)
USBIO: Down dev=2 endpt=0 datalen=255 numPackets=0 status=800 0
USBIO:  000: 80 06 01 03 09 04 ff 00                         ........
USBIO: Up dev=2 endpt=0 datalen=46 numPackets=0 status=0 0
USBIO:  000: 80 06 01 03 09 04 ff 00                         ........
USBIO:  000: 2e 03 56 00 4d 00 77 00 61 00 72 00 65 00 20 00 ..V.M.w.a.r.e. .
USBIO:  010: 56 00 69 00 72 00 74 00 75 00 61 00 6c 00 20 00 V.i.r.t.u.a.l. .
USBIO:  020: 55 00 53 00 42 00 20 00 48 00 75 00 62 00       U.S.B. .H.u.b.
They are designed to be somewhat human readable even without the Virtual USB Analyzer tool. Some very basic Chapter 9 protocol decoding is performed in the virtual USB stack, and packet data is dumped in hex and in ASCII. The "Down" lines indicate a request that is on its way from the guest OS to the (virtual) hardware, and an "Up" is a response or completion which is returning from the hardware back to the guest OS.
An example logging session
For this tutorial, we'll capture the USB bus traffic that results after plugging in a USB flash drive. We'll capture logs from both Windows and Linux virtual machines, so we can compare the two. We'd like to know what, if anything, is different about how Windows and Linux access USB storage devices.
To capture the logs, we'll take the following steps:
With the Windows VM suspended, add the new debug options to its .vmx config file:
monitor = "debug"
usb.analyzer.enable = TRUE
usb.analyzer.maxLine = 8192
mouse.vusb.enable = FALSE
And remove the existing virtual USB device definitions:
usb:0.present = "TRUE"
usb:1.present = "TRUE"
usb:1.deviceType = "hub"
usb:0.deviceType = "mouse"
Power on or resume the virtual machine.
There should be a new vmware.log file in the virtual machine's directory. It shouldn't contain any USBIO lines yet.
Now we'll start our test. We'll connect a USB disk to the Windows VM, let Windows mount it, copy a file off of it, then disconnect the disk.
Suspend the virtual machine.
To reduce the size of the log, we can filter out only the USBIO log entries and compress them. This is optional, vusb-analyzer can also be run directly on the vmware.log file.
grep USBIO vmware.log | gzip > windows-storage-read.log.gz
Edit the VMX file again, and remove the four lines we added in step 1. There's no need to re-add the usb:* lines, as they will be added automatically as necessary.
Now we'll repeat steps 1 through 7 with a Linux VM, for comparison later.
Viewing a single log file
This tutorial will assume you have a log file to view. If you skipped the section above, download one of the sample log files.
The vusb-analyzer tool's command line usage is pretty straightforward:
micah@carrot:~/download$ tar zxf vusb-analyzer-1.0.tar.gzmicah@carrot:~/download$ cd vusb-analyzer-1.0/micah@carrot:~/download/vusb-analyzer-1.0$ ./vusb-analyzerWarning: psyco not found, install it for a nice speed boost.
usage: ./vusb-analyzer [-t] vmx.log [vmx.log]

PyGTK frontend for the virtual USB analyzer
Micah Dowty-t  Tail mode, start from the end of a growing log file.

The provided log file may be a VMware VMX log file,
or an exported XML file from Ellisys Visual USB.
Logs may be appended to while this program is running.

For best results with Ellisys logs, enable 'Expand
transactions packets' but not 'Expand consecutive
elements' while exporting.

Two log files can be specified, in order to invoke
diff mode.

So, let's start by giving it a single log file. The UI should appear immediately along with the first section of the log file. If you're viewing a large log file, it will continue to load in the background. The progress bar at the bottom-right corner of the window indicates loading progress. It disappears when the file is fully loaded.
micah@carrot:~/download/vusb-analyzer-1.0$ ./vusb-analyzer ../linux-storage-read.log.gzWarning: psyco not found, install it for a nice speed boost.
Loaded decoder module 'Cypress'
Loaded decoder module 'Bluetooth'
Loaded decoder module 'Storage'
Installing decoder VUsbTools.Decoders.Storage.CommandDecoder
Installing decoder VUsbTools.Decoders.Storage.StatusDecoder

This is the main vusb-analyzer window. From top to bottom, it has three interesting regions:
The timing diagram. Each USB endpoint is allocated a row on this chart. The vertical stacking is arbitrary. The horizontal axis is time since the first log entry, in seconds.
Each box represents one USB transaction. The left edge is when the transaction started, the right edge marks its completion.
Transactions are color-coded by size: Zero-byte transfers are gray, small transfers are blue, large transfers are yellow.
Errors are marked by a red stripe at the end of a transaction box.
Left-click or left-drag to select transactions
Middle-click to zoom in
Right-click to zoom out
The transaction list. The beginning and end of every USB transaction appears here, in chronological order.
Left-click to select one transaction.
Use the keyboard arrows and page-up/page-down to quickly move through large logs.
Use ctrl-click and shift-click to select multiple transactions.
Right-click for filter and export options.
Double-click to open the detail window, which gives a full hex dump of the current transaction as well as decoded protocol information.
The status bar. In the right corner, this displays the current time at the cursor. The box to the left displays metrics for the hilighted group of transactions.
Making sense of URBs
The transactions we've been talking about so far are also known as USB Request Blocks (URBs). This is the typical unit of communication used by USB drivers. URBs are distinct from the actual packets that appear on the physical USB wire.
When a USB driver submits a URB to the operating system's USB stack, the USB stack converts this URB into a set of lower-level primitives (Transfer Descriptors) and sends it off to the USB host controller. The TDs tell the host controller to poll the device. The host controller continues to poll the device, in hardware, until the transfer is complete. When the last TD finishes, the host controller fires an interrupt, and the operating system completes the URB.
Since the Virtual USB analyzer only sees URBs, not wire-level packets or TDs, it is a higher level analyzer than a typical hardware analyzer like those made by Ellisys or LeCroy. It is more similar to USB Snoopy, which captures URBs as they traverse the Windows driver stack.
!When capturing USB logs with VMware, you won't always get URBs that look exactly like the ones originally submitted by the driver running in your VM. VMware does not modify the USB stack in your VM, it just emulates the industry-standard UHCI and EHCI controller chips. The URBs you see in the log were re-assembled from TDs that the guest OS submitted to the USB controller. They should be semantically identical to the original URBs, but you may see that URBs have been split or recombined.
This is how a single URB looks in the transaction list:

Each URB always has two entries in the list: One showing when the driver submitted it, and one showing when it completed. Most URBs complete pretty quickly, and their duration is a good measure of the latency we're experiencing from the device and the host machine's USB stack. This isn't always the case, though, as we'll see later.
From left to right, the columns in the transaction above:
Transfer direction and endpoint. The right arrow indicates a URB submission, and a left arrow indicates completion. The text in this column indicates the endpoint and endpoint direction, if applicable.
Time. This column records the wallclock time, measured in seconds since the first log event. The number after the colon is a line number in the log file, in case you want to cross-reference this list with the raw log data.
Device Address. This is the USB device address, as assigned by the operating system running within the VM. New devices always start out with address zero, then they are assigned a permanent address with the SET_ADDRESS control request.
Length. The transfer length, in bytes, not including SETUP data. When the URB is submitted, this is the size requested by the driver: The number of bytes to transfer, or the maximum number of bytes we want to receive. When the URB is completed, it indicates the actual amount of data we transferred. In this example, the driver is asking to read at most 0x40 bytes, and it gets back 0x12 bytes of data.
Setup. For control requests, this column displays the raw contents of the SETUPpacket, in hexadecimal.
Data. This is a hex dump of at most the first 16 bytes of data. To see a full dump, double-click the transaction list. Data will appear in the table when an output transfer is submitted, and when an input transfer is completed.
The rightmost column contains a summary of the decoded high-level protocol information in that transfer. Here's another example: the completion of a GET_DESCRIPTOR request for reading the configuration descriptor on the VMware Virtual Hub device.

Double-clicking this line reveals the detail window:
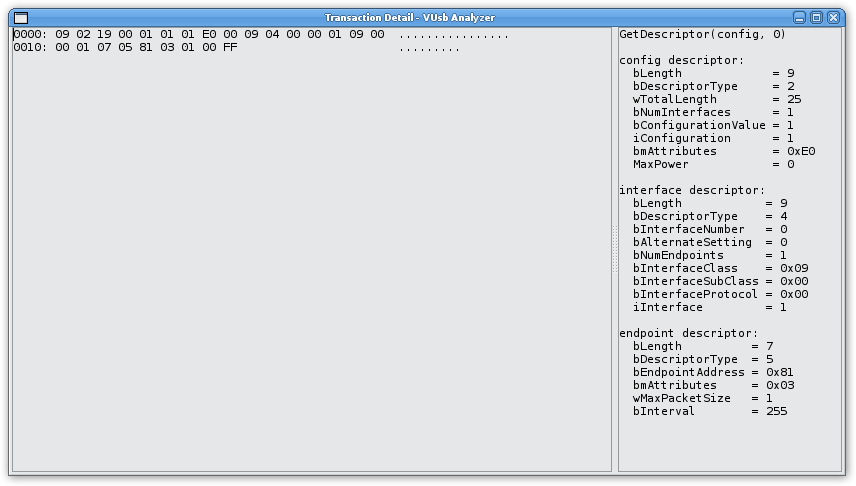
On the left side you'll find a full hex dump of the transfer data, on the right is the annotation provided by a protocol decoder plugin. In this case, it's disassembling a few of the standard USB Chapter 9 descriptors. You can copy and paste text from either side of the window.
Before you try copying and pasting hex dumps from this window, though, take a look at theExporting data section below.
Using the timing diagram
The timing diagram is a graphical visualization of the time, quantity, and size of URBs. The horizontal axis is time. The vertical axis is arbitrary, but transactions are first grouped by device and endpoint, then stacked tightly for the best space utilization.
Let's take a closer look at the beginning of the Linux USB storage log we captured above. If you skipped the capturing a log file section above, download one of the sample log files. The log file we're looking at here is linux-storage-read.

This is a typical diagram showing an enumeration sequence. In the "Dev 0, EP0" column, you can see the SET_ADDRESS URBs which give two other devices addresses 3 and 4. Immediately afterward, many small control requests are sent as the device's driver loads and initializes. All of these packets are very quick, and have very little data content.
Now we'll scroll right, just past 7 seconds. Enumeration is finished, and we're starting to see some SCSI traffic:

On the left, we see a handful of small packets on EP1 OUT and EP2 IN. These are SCSI INQUIRY, TEST_UNIT_READY, and friends. You can click on any URB to see its corresponding data in the transaction list. Any time you select an item in the timing diagram it will be selected in the transaction list, and vice versa. You can even middle-click to zoom in on these small transfers, or left-drag to "scrub" over them quickly to find a particular transaction.
You'll also notice a few red stripes on the graph. These are errors- in this case, the USB storage driver sent an unsupported command, so the device reported a stall. The red stripe on EP0 is an unsupported class-specific request, which also reported a stall.
On the right, you can see some actual SCSI READ requests. The color coding tells us that they're larger packets, and we immediately notice the huge stack of URBs. What does this mean?
Well, the timing diagram always places the left and right edges of a box according to the submission and completion timestamps of a URB. If multiple URBs are pending, the timing diagram will stack them vertically. The vertical stacking order is arbitrary, it just tries to fill space as efficiently as possible. As a general rule, the taller a stack is the more URBs are being run concurrently by the device's driver.
In this case, the guest's driver is submitting a command block for a SCSI READ request, then it immediately submits every URB it will need for that request's payload data. All of these URBs start at the same time, but they complete sequentially as the device actually delivers data back to the USB controller.
The vertical red line is the timing diagram cursor. It follows the mouse when you hover over the timing diagram, and it also jumps to the timestamp on any transaction you hilight in the transaction list. It's a good "You are here" marker to use when navigating the transaction list. It also helps you visually inspect many URBs relative to a single point in time. At this screenshot's cursor position, you can see that one URB is just ending, and 16 more are still pending.
For comparison's sake, let's load up the Windows counterpart to this log, to see how its USB stack differs. If you skipped the Capturing a log file section above, you can download the sample windows-storage-read log.

The difference is pretty striking. The tightly packed group of URBs on the left is a flood of TEST_UNIT_READY spam. on the right, we're sending actual READ requests. Instead of sending out all its URBs at once, the Windows storage driver keeps at most two outstanding at any time. It starts out by sending two URBs, then the moment the first one finishes it sends out another.
We can middle-click to zoom in and see this more clearly:

Even though the stacking is arbitrary, since vusb-analyzer is trying to fill space efficiently it will usually tend to put a new transaction in the space that opened up after another transaction completed. This means you can often see rows emerge, in which the driver always submits a new URB after a previous one completes. This makes it possible to quickly measure the latency both of the device and of the virtual machine and its USB driver.
Side-by-side diff mode
If we want to compare two logs, we could open them up in two separate vusb-analyzer windows, and look for similarities and differences between them. This would be okay for small logs, but it can quickly get very tedious, especially if the logs are nearly identical. We could diff the log files themselves, but there is a lot of noise data in there that we'd really like to ignore- things like timestamps and device addresses.
This diff mode was originally developed for comparing VMware's virtual URBs to the physial traffic that we could observe on the USB wire with a hardware analyzer. We would take a software analyzer trace and a hardware trace simultaneously, and load them into vusb-analyzer's diff mode as a way to debug our virtual USB stack.
This mode could be useful for other cases where you're trying to duplicate the behaviour of another piece of software. For example, if you're trying to write a Linux driver by reverse engineering the communications between a Windows driver and a proprietary device, you could use diff mode to compare your driver with the proprietary driver.
In this tutorial, we'll compare the Windows and Linux logs we captured above. If you skipped the Capturing a log file section, you can download the sample windows-storage-read and linux-storage-read logs.
To use diff mode, just run vusb-analyzer with two log filenames on the command line:
micah@carrot$ ./vusb-analyzer ../linux-storage-read.log.gz ../windows-storage-read.log.gzWarning: psyco not found, install it for a nice speed boost.
Loaded decoder module 'Cypress'
Loaded decoder module 'Bluetooth'
Loaded decoder module 'Storage'
Loaded decoder module 'Cypress'
Loaded decoder module 'Bluetooth'
Loaded decoder module 'Storage'
Installing decoder VUsbTools.Decoders.Storage.CommandDecoder
Installing decoder VUsbTools.Decoders.Storage.StatusDecoder
Installing decoder VUsbTools.Decoders.Storage.CommandDecoder
Installing decoder VUsbTools.Decoders.Storage.StatusDecoder
Installing decoder VUsbTools.Decoders.Storage.CommandDecoder
Installing decoder VUsbTools.Decoders.Storage.StatusDecoder

The resulting window will have a lot of information. I hope you have a large monitor! The transaction list from each log will appear side-by-side, with the first log on the left and the second on the right. Additionally, the timing diagrams will appear stacked, with the first log on top and second on bottom.
Most importantly, you will see diff markers: A column of line markers will separate the two transaction lists, and each timing diagram will have green striped areas.
!You may not see any diff notes immediately. It can take vusb-analyzer some time to load both log files into memory, and it only computes the differences between the two files after both are fully loaded.

A blank space in the marker column indicates that the transactions on the left and right side match. The "<" and ">" markers indicate that a transaction only exists on one side, and the "|" marker means that the transaction was modified.
For any areas which match, vusb-analyzer will link your selection. When you click a transaction on the left side, it will hilight the matching transaction on the right side, and on both timing diagrams.
The timing diagrams will show matching regions with a green band. All URBs inside that band matched with a group of URBs in the other log. If you click one of these URBs, the matching URB will be hilighted in the other timing diagram and in both transaction lists.

This image shows a section where the first log has three extra URBs as compared to the bottom log, but they otherwise match exactly.
Exporting data
The Virtual USB Analyzer is useful for analyzing the structure of a USB sniffer log, but sometimes you just want to extract some data. This could be blocks of data that were read or written from a disk, or perhaps a firmware image that a device's driver automatically sends on connect. The Virtual USB Analyzer has some tools that make it easier to select transactions and dump their data to disk.
In this example, we'll extract audio data which was logged on its way to a pair of USB headphones. If you want to follow along, you can download the sample windows-audio-playback log file.
Here's an example of what audio playback looks like in this log:

The control requests on EP0 are initializing the stream, and EP1 OUT carries the actual Isochronous packets which carry the audio data. EP3 IN is polling for button presses from the device's HID interface. This screenshot is the short sound effect that Windows plays after a new hardware device is attached. Later in the file we'll see a longer stream playing:

Let's try to capture the long stream, ignoring the Windows sound effect. If you click the top-left URB in the EP1 OUT pipe, shortly after 38 seconds, the transaction list will hilight the corresponding completion event. To hilight the rest:
Click the transaction once, to give it keyboard focus.
Hold down Shift, to select multiple items, and start pressing Page Down. Your selection will grow, and the timing diagram cursor will move to show you where you are.
Select all of the URBs you're interested in. In this case, we want the whole rest of the log. Another way to select all of these transactions is to shift-click once on the last transaction you're interested in.
Now we can filter the selection to include only EP1 OUT. Not a lot is going on in this log, but in a busier log this can make sure you aren't grabbing unintended packets from other interfaces.

Once you have the proper transactions hilighted, right click again and pick "Save Selected Data...". This writes out a raw binary file which contains the payload from all selected packets, concatenated in chronological order. We'll save this data to "audio.raw".
Now we can play it. The 'play' tool included with sox can handle headerless audio files:
micah@carrot:~$ ls -l audio.raw
-rw-r--r-- 1 micah micah 2284556 2009-01-12 12:24 audio.raw
micah@carrot:~$ play -r 44100 -c 2 -s -2 audio.raw

Input File     : 'audio.raw'
Sample Size    : 16-bit (2 bytes)
Sample Encoding: signed (2's complement)
Channels       : 2
Sample Rate    : 44100

Time: 00:12.95 [00:00.00] of 00:00.00 (0.00%) Samples out: 571k  Clips: 0
Done.
上一篇:python常用资源及代码
下一篇:SBT-PC接收数据